In the ever-evolving landscape of data management and business intelligence, understanding the tools and concepts at your disposal is crucial. Among these tools, the terms “semantic model” and “data mart” often surface, particularly in the context of Microsoft Fabric. While they might seem similar at a glance, they serve distinct purposes and operate at different layers within a data ecosystem. Let’s delve into these concepts to understand their roles, differences, and how they can be leveraged effectively.
What is a Semantic Model in Microsoft Fabric?
A semantic model is designed to provide a user-friendly, abstracted view of complex data, making it easier for users to interpret and analyze information without needing to dive deep into the underlying data structures. In the realm of Microsoft Fabric, semantic models play a critical role within business intelligence (BI) tools like Power BI.
Key Features of Semantic Models:
Purpose: Simplifies complex data, offering an understandable and meaningful representation.
Usage: Utilized within BI tools for creating reports and dashboards, enabling analysts and business users to work efficiently.
Components: Comprises metadata, relationships between tables, measures (calculated fields), and business logic.
Examples: Power BI data models, Analysis Services tabular models.
What is a Data Mart?
On the other hand, a data mart is a subset of a data warehouse, focused on a specific business area or department, such as sales, finance, or marketing. It is tailored to meet the particular needs of a specific group of users, providing a performance-optimized environment for querying and reporting.
Key Features of Data Marts:
Purpose: Serves as a focused, subject-specific subset of a data warehouse.
Usage: Provides a tailored dataset for analysis and reporting in a specific business domain.
Components: Includes cleaned, integrated, and structured data relevant to the business area.
Examples: Sales data mart, finance data mart, customer data mart.
Semantic Model vs. Data Mart: Key Differences
Here is a table outlining the key differences between a Semantic Model and a Data Mart:
Aspect
Semantic Model
Data Mart
Scope
Encompasses a broader scope within a BI tool, facilitating report and visualization creation across various data sources.
Targets a specific subject area, offering a specialized dataset optimized for that domain.
Abstraction vs. Storage
Acts as an abstraction layer, providing a simplified view of the data.
Physically stores data in a structured manner tailored to a particular business function.
Users
Primarily used by business analysts, data analysts, and report creators within BI tools.
Utilized by business users and decision-makers needing specific data for their department.
Implementation
Implemented within BI tools like Power BI, often utilizing DAX (Data Analysis Expressions) to define measures and relationships.
Implemented within database systems, using ETL (Extract, Transform, Load) processes to load and structure data.
Semantic Model vs. Data Mart: Key Differences
This table highlights the unique benefits the benefits that a Semantic Models and Data Marts offers, helping organisations choose the right tool for their specific needs.
Aspect
Benefits of Semantic Model
Benefits of Data Mart
User-Friendliness
Provides a user-friendly view of data, making it easier for non-technical users to create reports and visualizations.
Offers a specialized and simplified dataset tailored to the specific needs of a business area.
Efficiency
Reduces the complexity of data for report creation and analysis, speeding up the process for end-users.
Enhances query performance by providing a focused, optimized dataset for a specific function or department.
Consistency
Ensures consistency in reporting by centralizing business logic and calculations within the model.
Ensures data relevancy and accuracy for a specific business area, reducing data redundancy.
Integration
Allows integration of data from multiple sources into a unified model, facilitating comprehensive analysis.
Can be quickly developed and deployed for specific departmental needs without impacting the entire data warehouse.
Flexibility
Supports dynamic and complex calculations and measures using DAX, adapting to various analytical needs.
Provides flexibility in data management for individual departments, allowing them to focus on their specific metrics.
Collaboration
Enhances collaboration among users by providing a shared understanding and view of the data.
Facilitates departmental decision-making by providing easy access to relevant data.
Maintenance
Simplifies maintenance as updates to business logic are centralized within the semantic model.
Reduces the workload on the central data warehouse by offloading specific queries and reporting to data marts.
Scalability
Scales easily within BI tools to accommodate growing data and more complex analytical requirements.
Can be scaled horizontally by creating multiple data marts for different business areas as needed.
Conclusion
While semantic models and data marts are both integral to effective data analysis and reporting, they serve distinct purposes within an organization’s data architecture. A semantic model simplifies and abstracts complex data for BI tools, whereas a data mart structures and stores data for specific business needs. Understanding these differences allows businesses to leverage each tool appropriately, enhancing their data management and decision-making processes.
By comprehensively understanding and utilizing semantic models and data marts within Microsoft Fabric, organizations can unlock the full potential of their data, driving insightful decisions and strategic growth.
Leveraging the right tools can make a significant difference in how organisations harness and interpret their data. Two powerful tools that, when combined, offer unparalleled capabilities are Power BI and Azure Data Marts. In this blog post, we compare and will explore how these tools integrate seamlessly to provide robust, scalable, and high-performance data analytics solutions.
What is a Data Mart
A data mart is a subset of a data warehouse that is focused on a specific business line, team, or department. It contains a smaller, more specific set of data that addresses the particular needs and requirements of the users within that group. Here are some key features and purposes of a data mart:
Subject-Specific: Data marts are designed to focus on a particular subject or business area, such as sales, finance, or marketing, making the data more relevant and easier to analyse for users within that domain.
Simplified Data Access: By containing a smaller, more focused dataset, data marts simplify data access and querying processes, allowing users to retrieve and analyse information more efficiently.
Improved Performance: Because data marts deal with smaller datasets, they generally offer better performance in terms of data retrieval and processing speed compared to a full-scale data warehouse.
Cost-Effective: Building a data mart can be less costly and quicker than developing an enterprise-wide data warehouse, making it a practical solution for smaller organisations or departments with specific needs.
Flexibility: Data marts can be tailored to the specific requirements of different departments or teams, providing customised views and reports that align with their unique business processes.
There are generally two types of data marts:
Dependent Data Mart: These are created by drawing data from a central data warehouse. They depend on the data warehouse for their data, which ensures consistency and integration across the organisation.
Independent Data Mart: These are standalone systems that are created directly from operational or external data sources without relying on a central data warehouse. They are typically used for departmental or functional reporting.
In summary, data marts provide a streamlined, focused approach to data analysis by offering a subset of data relevant to specific business areas, thereby enhancing accessibility, performance, and cost-efficiency.
Understanding the Tools: Power BI and Azure Data Marts
Power BI Datamarts: Power BI is a leading business analytics service by Microsoft that enables users to create interactive reports and dashboards. With its user-friendly interface and powerful data transformation capabilities, Power BI allows users to connect to a wide range of data sources, shape the data as needed, and share insights across their organisation. Datamarts in Power BI Premium are self-service analytics solutions that allow users to store and explore data in a fully managed database.
Azure Data Marts: Azure Data Marts are a component of Azure Synapse Analytics, designed to handle large volumes of structured and semi-structured data. They provide high-performance data storage and processing capabilities, leveraging the power of distributed computing to ensure efficient query performance and scalability.
Microsoft Fabric:
In Sep’23, as a significant step forward for data management and analytics, Microsoft has bundled Power BI and Azure Synapse Analytics (including Azure Data Marts) as part of its Fabric SaaS suite. This comprehensive solution, known as Microsoft Fabric, represents the next evolution in data management. By integrating these powerful tools within a single suite, Microsoft Fabric provides a unified platform that enhances data connectivity, transformation, and visualisation. Users can now leverage the full capabilities of Power BI and Azure Data Marts seamlessly, driving more efficient data workflows, improved performance, and advanced analytics capabilities, all within one cohesive ecosystem. This integration is set to revolutionise how organisations handle their data, enabling deeper insights and more informed decision-making.
The Synergy: How Power BI and Azure Data Marts Work Together
Integration and Compatibility
Data Connectivity: Power BI offers robust connectivity options that seamlessly link it with Azure Data Marts. Users can choose between Direct Query and Import modes, ensuring they can access and analyse their data in real-time or work with offline datasets for faster querying.
Data Transformation: Using Power Query within Power BI, users can clean, transform, and shape data imported from Azure Data Warehouses or Azure Data Marts into PowerBI Data Marts. This ensures that data is ready for analysis and visualisation, enabling more accurate and meaningful insights.
Visualisation and Reporting: With the transformed data, Power BI allows users to create rich, interactive reports and dashboards. These visualisations can then be shared across the organisation, promoting data-driven decision-making.
Workflow Integration
The integration of Power BI with Azure Data Marts follows a streamlined workflow:
Data Storage: Store large datasets in Azure Data Marts, leveraging its capacity to handle complex queries and significant data volumes.
ETL Processes: Utilise Power Query or Azure Data Factory or other ETL tools to manage data extraction, transformation, and loading into the Data Mart.
Connecting to Power BI: Link Power BI to Azure Data Marts using its robust connectivity options.
Further Data Transformation: Refine the data within Power BI using Power Query to ensure it meets the analytical needs.
Creating Visualisations: Develop interactive and insightful reports and dashboards in Power BI.
Sharing Insights: Distribute the reports and dashboards to stakeholders, fostering a culture of data-driven insights.
Benefits of the Integration
Scalability: Azure Data Marts provide scalable storage and processing, while Power BI scales visualisation and reporting.
Performance: Enhanced performance through optimised queries and real-time data access.
Centralised Data Management: Ensures data consistency and governance, leading to accurate and reliable reporting.
Advanced Analytics: Combining both tools allows for advanced analytics, including machine learning and AI, through integrated Azure services.
In-Depth Comparison: Power BI Data Mart vs Azure Data Mart
Comparing the features, scalability, and resilience of a PowerBI Data Mart and an Azure Data Mart or Warehouse reveals distinct capabilities suited to different analytical needs and scales. Here’s a detailed comparison:
Features
PowerBI Data Mart:
Integration: Seamlessly integrates with Power BI for reporting and visualisation.
Ease of Use: User-friendly interface designed for business users with minimal technical expertise.
Self-service: Enables self-service analytics, allowing users to create their own data models and reports.
Data Connectivity: Supports connections to various data sources, including cloud-based and on-premises systems.
Data Transformation: Built-in ETL (Extract, Transform, Load) capabilities for data preparation.
Real-time Data: Can handle near-real-time data through direct query mode.
Collaboration: Facilitates collaboration with sharing and collaboration features within Power BI.
Azure Data Warehouse (Azure Synapse Analytics / Microsoft Fabric Data Warehouse):
Data Integration: Deep integration with other Azure services (Azure Data Factory, Azure Machine Learning, etc.).
Data Scale: Capable of handling massive volumes of data with distributed computing architecture.
Performance: Optimised for large-scale data processing with high-performance querying.
Advanced Analytics: Supports advanced analytics with integration for machine learning and AI.
Security: Robust security features including encryption, threat detection, and advanced network security.
Scalability: On-demand scalability to handle varying workloads.
Cost Management: Pay-as-you-go pricing model, optimising costs based on usage.
Scalability
PowerBI Data Mart:
Scale: Generally suitable for small to medium-sized datasets.
Performance: Best suited for departmental or team-level reporting and analytics.
Limits: Limited scalability for very large datasets or complex analytical queries.
Azure Data Warehouse:
Scale: Designed for enterprise-scale data volumes, capable of handling petabytes of data.
Performance: High scalability with the ability to scale compute and storage independently.
Elasticity: Automatic scaling and workload management for optimised performance.
Resilience
PowerBI Data Mart:
Redundancy: Basic redundancy features, reliant on underlying storage and compute infrastructure.
Recovery: Limited disaster recovery features compared to enterprise-grade systems.
Fault Tolerance: Less fault-tolerant for high-availability requirements.
Azure Data Warehouse:
Redundancy: Built-in redundancy across multiple regions and data centres.
Recovery: Advanced disaster recovery capabilities, including geo-replication and automated backups.
Fault Tolerance: High fault tolerance with automatic failover and high availability.
Support for Schemas
Both PowerBI Data Mart and Azure Data Warehouse support the following schemas:
Star Schema:
PowerBI Data Mart: Supports star schema for simplified reporting and analysis.
Azure Data Warehouse: Optimised for star schema, enabling efficient querying and performance.
Snowflake Schema:
PowerBI Data Mart: Can handle snowflake schema, though complexity may impact performance.
Azure Data Warehouse: Well-suited for snowflake schema, with advanced query optimisation.
Galaxy Schema:
PowerBI Data Mart: Limited support, better suited for simpler schemas.
Azure Data Warehouse: Supports galaxy schema, suitable for complex and large-scale data models.
Summary
PowerBI Data Mart: Ideal for small to medium-sized businesses or enterprise departmental analytics with a focus on ease of use, self-service, and integration with Power BI.
Azure Data Warehouse: Best suited for large enterprises requiring scalable, resilient, and high-performance data warehousing solutions with advanced analytics capabilities.
This table provides a clear comparison of the features, scalability, resilience, and schema support between PowerBI Data Mart and Azure Data Warehouse.
Feature/Aspect
PowerBI Data Mart
Azure Data Warehouse (Azure Synapse Analytics)
Integration
Seamless with Power BI
Deep integration with Azure services
Ease of Use
User-friendly interface
Requires technical expertise
Self-service
Enables self-service analytics
Supports advanced analytics
Data Connectivity
Various data sources
Wide range of data sources
Data Transformation
Built-in ETL capabilities
Advanced ETL with Azure Data Factory
Real-time Data
Supports near-real-time data
Capable of real-time analytics
Collaboration
Sharing and collaboration features
Collaboration through Azure ecosystem
Data Scale
Small to medium-sized datasets
Enterprise-scale, petabytes of data
Performance
Suitable for departmental analytics
High-performance querying
Advanced Analytics
Basic analytics
Advanced analytics and AI integration
Security
Basic security features
Robust security with encryption and threat detection
Scalability
Limited scalability
On-demand scalability
Cost Management
Included in Power BI subscription
Pay-as-you-go pricing model
Redundancy
Basic redundancy
Built-in redundancy across regions
Recovery
Limited disaster recovery
Advanced disaster recovery capabilities
Fault Tolerance
Less fault-tolerant
High fault tolerance and automatic failover
Star Schema Support
Supported
Optimised support
Snowflake Schema Support
Supported
Well-suited and optimised
Galaxy Schema Support
Limited support
Supported for complex models
Datamart: PowerBI vs Azure
Conclusion
Integrating Power BI with Azure Data Marts is a powerful strategy for any organisation looking to enhance its data analytics capabilities. Both platforms support star, snowflake, and galaxy schemas, but Azure Data Warehouse provides better performance and scalability for complex and large-scale data models. The seamless integration offers a robust, scalable, and high-performance solution, enabling users to gain deeper insights and make informed decisions.
Additionally, with Power BI and Azure Data Marts now bundled as part of Microsoft’s Fabric SaaS suite, users benefit from a unified platform that enhances data connectivity, transformation, visualisation, scalability and resilience, further revolutionising data management and analytics.
By leveraging the strengths of Microsoft’s Fabric, organisations can unlock the full potential of their data, driving innovation and success in today’s data-driven world.
In the contemporary landscape of data-driven decision-making, robust data management practices are critical for organisations seeking to harness the full potential of their data assets. Effective data management encompasses various components, each playing a vital role in ensuring data integrity, accessibility, and usability.
Key components such as data catalogues, taxonomies, common data models, data dictionaries, master data, data lineage, data lakes, data warehouses, data lakehouses, and data marts, along with their interdependencies and sequences within the data lifecycle, form the backbone of a sound data management strategy.
This cocise guide explores these components in detail, elucidating their definitions, uses, and how they interrelate to support seamless data management throughout the data lifecycle.
Definitions and Usage of Key Data Management Components
Data Catalogue
Definition: A data catalogue is a comprehensive inventory of data assets within an organisation. It provides metadata, data classification, and information on data lineage, data quality, and data governance.
Usage: Data catalogues help data users discover, understand, and manage data. They enable efficient data asset management and ensure compliance with data governance policies.
Data Taxonomy
Definition: Data taxonomy is a hierarchical structure that organises data into categories and subcategories based on shared characteristics or business relevance.
Usage: It facilitates data discovery, improves data quality, and aids in the consistent application of data governance policies by providing a clear structure for data classification.
Data Dictionary
Definition: A data dictionary is a centralised repository that describes the structure, content, and relationships of data elements within a database or information system.
Usage: Data dictionaries provide metadata about data, ensuring consistency in data usage and interpretation. They support database management, data governance, and facilitate communication among stakeholders.
Master Data
Definition: Master data represents the core data entities that are essential for business operations, such as customers, products, employees, and suppliers. It is a single source of truth for these key entities.
Usage: Master data management (MDM) ensures data consistency, accuracy, and reliability across different systems and processes, supporting operational efficiency and decision-making.
Common Data Model (CDM)
Definition: A common data model is a standardised framework for organising and structuring data across disparate systems and platforms, enabling data interoperability and consistency.
Usage: CDMs facilitate data integration, sharing, and analysis across different applications and organisations, enhancing data governance and reducing data silos.
Data Lake
Definition: A data lake is a centralised repository that stores raw, unprocessed data in its native format, including structured, semi-structured, and unstructured data.
Usage: Data lakes enable large-scale data storage and processing, supporting advanced analytics, machine learning, and big data initiatives. They offer flexibility in data ingestion and analysis.
Data Warehouse
Definition: A data warehouse is a centralised repository that stores processed and structured data from multiple sources, optimised for query and analysis.
Usage: Data warehouses support business intelligence, reporting, and data analytics by providing a consolidated view of historical data, facilitating decision-making and strategic planning.
Data Lakehouse
Definition: A data lakehouse is a modern data management architecture that combines the capabilities of data lakes and data warehouses. It integrates the flexibility and scalability of data lakes with the data management and ACID (Atomicity, Consistency, Isolation, Durability) transaction support of data warehouses.
Usage: Data lakehouses provide a unified platform for data storage, processing, and analytics. They allow organisations to store raw and processed data in a single location, making it easier to perform data engineering, data science, and business analytics. The architecture supports both structured and unstructured data, enabling advanced analytics and machine learning workflows while ensuring data integrity and governance.
Data Mart
Definition: A data mart is a subset of a data warehouse that is focused on a specific business line, department, or subject area. It contains a curated collection of data tailored to meet the specific needs of a particular group of users within an organisation.
Usage: Data marts are used to provide a more accessible and simplified view of data for specific business functions, such as sales, finance, or marketing. By focusing on a narrower scope of data, data marts allow for quicker query performance and more relevant data analysis for the target users. They support tactical decision-making by enabling departments to access the specific data they need without sifting through the entire data warehouse. Data marts can be implemented using star schema or snowflake schema to optimize data retrieval and analysis.
Data Lineage
Definition: Data lineage refers to the tracking and visualisation of data as it flows from its source to its destination, showing how data is transformed, processed, and used over time.
Usage: Data lineage provides transparency into data processes, supporting data governance, compliance, and troubleshooting. It helps understand data origin, transformations, and data usage across the organisation.
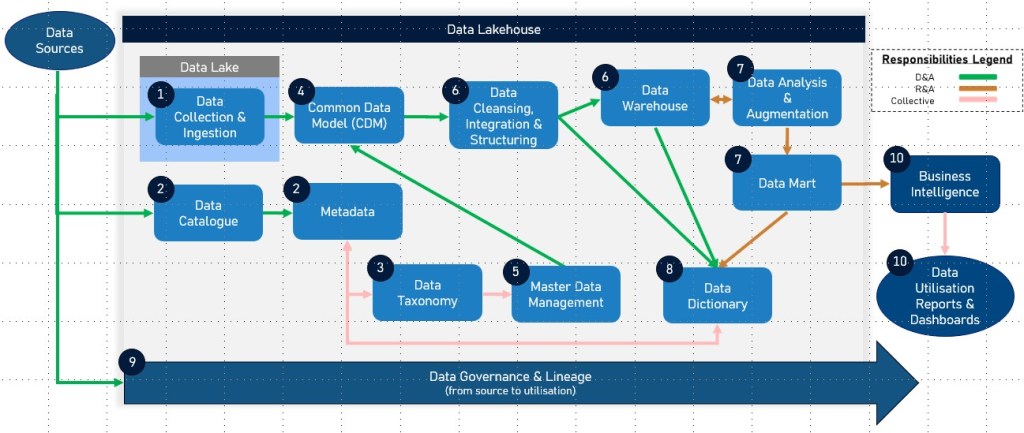
Dependencies and Sequence in the Data Life Cycle
Data Collection and Ingestion – Data is collected from various sources and ingested into a data lake for storage in its raw format.
Data Cataloguing and Metadata Management – A data catalogue is used to inventory and organise data assets in the data lake, providing metadata and improving data discoverability. The data catalogue often includes data lineage information to track data flows and transformations.
Data Classification and Taxonomy – Data is categorised using a data taxonomy to facilitate organisation and retrieval, ensuring data is easily accessible and understandable.
Data Structuring and Integration – Relevant data is structured and integrated into a common data model to ensure consistency and interoperability across systems.
Master Data Management – Master data is identified, cleansed, and managed to ensure consistency and accuracy across into the datawarehouse and other systems.
Data Transformation and Loading – Data is processed, transformed, and loaded into a data warehouse for efficient querying and analysis.
Focused Data Subset – Data relevant to and required for business a sepcific domain i.e. Financial data analytics and reporting are augmented into a Domain Specific Data Mart.
Data Dictionary Creation – A data dictionary is developed to provide detailed metadata about the structured data, supporting accurate data usage and interpretation.
Data Lineage Tracking – Throughout the data lifecycle, data lineage is tracked to document the origin, transformations, and usage of data, ensuring transparency and aiding in compliance and governance.
Data Utilisation and Analysis – Structured data in the data warehouse and/or data mart is used for business intelligence, reporting, and analytics, driving insights and decision-making.
Summary of Dependencies
Data Sources → Data Catalogue → Data Taxonomy → Data Dictionary → Master Data → Common Data Model → Data Lineage → Data Lake → Data Warehouse → Data Lakehouse → Data Mart → Reports & Dashboards
Data Lake: Initial storage for raw data.
Data Catalogue: Provides metadata, including data lineage, and improves data discoverability in the data lake.
Data Taxonomy: Organises data for better accessibility and understanding.
Common Data Model: Standardises data structure for integration and interoperability.
Data Dictionary: Documents metadata for structured data.
Data Lakehouse: Integrates the capabilities of data lakes and data warehouses, supporting efficient data processing and analysis.
Data Warehouse: Stores processed data for analysis and reporting.
Data Mart: Focused subset of the data warehouse tailored for specific business lines or departments.
Master Data: Ensures consistency and accuracy of key business entities across systems.
Data Lineage: Tracks data flows and transformations throughout the data lifecycle, supporting governance and compliance.
Each component plays a crucial role in the data lifecycle, with dependencies that ensure data is efficiently collected, managed, and utilised for business value. The inclusion of Data Lakehouse and Data Mart enhances the architecture by providing integrated, flexible, and focused data management solutions, supporting advanced analytics and decision-making processes. Data lineage, in particular, provides critical insights into the data’s journey, enhancing transparency and trust in data processes.
Tooling for key data management components
Selecting the right tools to govern, protect, and manage data is paramount for organisations aiming to maximise the value of their data assets. Microsoft Purview and CluedIn are two leading solutions that offer comprehensive capabilities in this domain. This comparison table provides a detailed analysis of how each platform addresses key data management components, including data catalogues, taxonomies, common data models, data dictionaries, master data, data lineage, data lakes, data warehouses, data lakehouses, and data marts. By understanding the strengths and functionalities of Microsoft Purview and CluedIn, organisations can make informed decisions to enhance their data management strategies and achieve better business outcomes.
Data Management Component
Microsoft Purview
CluedIn
Data Catalogue
Provides a unified data catalog that captures and describes data metadata automatically. Facilitates data discovery and governance with a business glossary and technical search terms.
Offers a comprehensive data catalog with metadata management, improving discoverability and governance of data assets across various sources.
Data Taxonomy
Supports data classification and organization using built-in and custom classifiers. Enhances data discoverability through a structured taxonomy.
Enables data classification and organization using vocabularies and custom taxonomies. Facilitates better data understanding and accessibility.
Common Data Model (CDM)
Facilitates data integration and interoperability by supporting standard data models and classifications. Integrates with Microsoft Dataverse.
Natively supports the Common Data Model and integrates seamlessly with Microsoft Dataverse and other Azure services, ensuring flexible data integration.
Data Dictionary
Functions as a detailed data dictionary through its data catalog, documenting metadata for structured data and providing detailed descriptions.
Provides a data dictionary through comprehensive metadata management, documenting and describing data elements across systems.
Data Lineage
Offers end-to-end data lineage, visualizing data flows across various platforms like Data Factory, Azure Synapse, and Power BI.
Provides detailed data lineage tracking, extending Purview’s lineage capabilities with additional processing logs and insights.
Data Lake
Integrates with Azure Data Lake, managing metadata and governance policies to ensure consistency and compliance.
Supports integration with data lakes, managing and governing the data stored within them through comprehensive metadata management.
Data Warehouse
Supports data warehouses by cataloging and managing metadata for structured data used in analytics and business intelligence.
Integrates with data warehouses, ensuring data governance and quality management, and supporting analytics with tools like Azure Synapse and Power BI.
Data Lakehouse
Not explicitly defined as a data lakehouse, but integrates capabilities of data lakes and warehouses to support hybrid data environments.
Integrates with both data lakes and data warehouses, effectively supporting the data lakehouse model for seamless data management and governance.
Master Data
Manages master data effectively by ensuring consistency and accuracy across systems through robust governance and classification.
Excels in master data management by consolidating, cleansing, and connecting data sources into a unified view, ensuring data quality and reliability.
Data Governance
Provides comprehensive data governance solutions, including automated data discovery, classification, and policy enforcemen.
Offers robust data governance features, integrating with Azure Purview for enhanced governance capabilities and compliance tracking.
Data governance tooling: Purview vs CluedIn
Conclusion
Navigating the complexities of data management requires a thorough understanding of the various components and their roles within the data lifecycle. From initial data collection and ingestion into data lakes to the structuring and integration within common data models and the ultimate utilisation in data warehouses and data marts, each component serves a distinct purpose. Effective data management solutions like Microsoft Purview and CluedIn exemplify how these components can be integrated to provide robust governance, ensure data quality, and facilitate advanced analytics. By leveraging these tools and understanding their interdependencies, organisations can build a resilient data infrastructure that supports informed decision-making, drives innovation, and maintains regulatory compliance.