The Scrum of Scrums is a scaled agile framework used to coordinate the work of multiple Scrum teams working on the same product or project. It is a meeting or a communication structure that allows teams to discuss their progress, identify dependencies, and address any challenges that may arise during the development process. The Scrum of Scrums is often employed in large organisations where a single Scrum team may not be sufficient to deliver a complex product or project.
The primary purpose of the Scrum of Scrums is to facilitate coordination and communication among multiple Scrum teams. It ensures that all teams are aligned towards common goals and are aware of each other’s progress.
Here are some key aspects of the Scrum of Scrums:
Frequency:
The frequency of Scrum of Scrums meetings depends on the project’s needs, but they are often daily or multiple times per week to ensure timely issue resolution.
Shorter daily meetings focussing on progress, next steps and blockers can be substantiated by a longer weekly meeting covering an agenda of all projects and more detailed discussions.
Participants – Scrum Teams and Representatives:
In a large-scale project or programme, there are multiple Scrum teams working on different aspects of the product or project.
Each Scrum team is represented by one or more members (often the Scrum Masters or team leads) in the Scrum of Scrums meeting. Each team selects one or more representatives to attend the Scrum of Scrums meeting.
These representatives are typically Scrum Masters or team leads who can effectively communicate the status, challenges, and dependencies of their respective teams.
The purpose of these representatives is to share information about their team’s progress, discuss impediments, and collaborate on solutions.
Meeting Structure & Agenda:
The Scrum of Scrums meeting follows a structured agenda that may include updates on team progress, identification of impediments, discussion of cross-team dependencies, reviewing and updating the overall RAID log with associated mitigation action progress and and collaborative problem-solving.
A key focus of the Scrum of Scrums is identifying and addressing cross-team dependencies. Teams discuss how their work may impact or be impacted by the work of other teams, and they collaboratively find solutions to minimise bottlenecks and define a overall critical path / timeline for the project delivery.
Tools and Techniques:
While the Scrum of Scrums is often conducted through face-to-face meetings, organisations may use various tools and techniques for virtual collaboration, especially if teams are distributed geographically. Video conferencing, collaboration platforms, and digital boards are common aids.
Focus on Coordination:
The primary goal of the Scrum of Scrums is to facilitate communication and coordination among the different Scrum teams.
Teams discuss their plans, commitments, and any issues they are facing. This helps in identifying dependencies and potential roadblocks early on.
Problem Solving:
If there are impediments or issues that cannot be resolved within individual teams, the Scrum of Scrums provides a forum for collaborative problem-solving.
The focus is on finding solutions that benefit the overall project, rather than just individual teams.
Scaling Agile:
The Scrum of Scrums is in line with the agile principles of adaptability and collaboration. It allows organisations to scale agile methodologies effectively by maintaining the iterative and incremental nature of Scrum while accommodating the complexities of larger projects.
Information Flow: & Sharing
The Scrum of Scrums ensures that information flows smoothly between teams, preventing silos of knowledge and promoting transparency across the organisation.
The Scrum of Scrums provides a platform for teams to discuss impediments that go beyond the scope of individual teams. It fosters a collaborative environment where teams work together to solve problems and remove obstacles that hinder overall progress.
Transparency is a key element of agile development, and the Scrum of Scrums promotes it by ensuring that information flows freely between teams. This helps prevent misunderstandings, duplication of effort, and ensures that everyone is aware of the overall project status.
Adaptability:
The Scrum of Scrums is adaptable to the specific needs and context of the organisation. It can be tailored based on the size of the project, the number of teams involved, and the nature of the work being undertaken.
In summary, the Scrum of Scrums is a crucial component in the toolkit of agile methodologies for large-scale projects. It fosters collaboration, communication, and problem-solving across multiple Scrum teams, ensuring that the benefits of agile development are retained even in complex and extensive projects.
In Summary, the Scrum of Scrums is a crucial component in the toolkit of agile methodologies for large-scale projects. It fosters collaboration, communication, and problem-solving across multiple Scrum teams, ensuring that the benefits of agile development are retained even in complex and extensive projects.
It’s important to note that the Scrum of Scrums is just one of several techniques used for scaling agile. Other frameworks like SAFe (Scaled Agile Framework), LeSS (Large-Scale Scrum), and Nexus also provide structures for coordinating the work of multiple teams. The choice of framework depends on the specific needs and context of the organisation.
The Agile fixed price is a contractual model agreed upon by suppliers and customers of IT projects that develop software using Agile methods. The model introduces an initial concept & scoping phase after which budget, due date, and the way of steering the scope within the framework is agreed upon. This differs from traditional fixed-price contracts in that fixed-price contracts usually require a detailed and exact description of the subject matter of the contract in advance.
Fixed price contracts are evil – this is what can often be heard from agilest. On the other hand, those contracts are reality which many agile teams have to face. But what if we try to embrace and manage it instead of fighting against it? How can a company execute this kind of contract using agile practices to achieve better results with lower risk? This article will try to answer those questions.
Fixed Price, Time and Scope
Fixed price contracts freeze three project factors at once – money, time and scope – but this should not be a problem for agile teams. In fact, time boxing is common agile practice. Limiting money simply makes time boxing work better.
A real problem with fixed price contracts is the scope, which is fixed in terms of what should exactly be built instead of how much should we build.
Why are clients so obsessed with fixing the scope? We understand that they want to know how much they will pay (who does not want to know that) and when they will get the product. The only thing they don’t know, even if they will not always admit it, is what exactly they want as the final product.
The reason for fixing the scope has its roots in:
Lack of trust between the contractors.
Lack of understanding about how the agile software development methodology and processes work.
Misunderstanding what the scope means.
Every fixed price contract has a companion document, the “Requirements Specification” or something similar. Most of the time, working in an Agile way, the business requirements are relatively light weight criptic notes captured on stickies or story boards and not in comprehensive Business Requirement Documents (BRDs) pre-approved by business before developemnt commences. Documented requirements tries to reduce the risk of forgetting something important and tries to set a common understanding of what should be done to provide an illusion of predictability of what the business actually wants and needs in the final product.
Key wrong assumptions in fixing the scope are:
The more detail we include in the requirements and scope definition up front, the better we understand each other.
Well-defined scope will prevent changes.
A fixed scope is needed to better estimate price and time.
Converting the Fixed Scope into Fixed Budget
In understanding that the main conflict between application of an agile mindset and a fixed price contract lies in the fixed scope, we can now focus on converting the fixed scope into the fixed budget.
A well defined scope is done by capturing business requirements in as many user stories instead of providing a detailed specification of requirements. These stories are built into a product backlog. The effort required to deliver each story is estimated using one of many story point techniques, like planning poker.
It is key to understand that a higher level of detail in software requirements specifications, means two completely different things for both parties within a contract. Software companies (vendors / supplier), responsible for developing applications, will usually focus on technical details while the company using the software (buying party / customer) is more user focussed and business outcome oriented.
In compiling specifications four key aspects are in play:
User stories is a way of expressing requirements, understandable for both suppliers and customers. The understanding builds trust and a sense of common vision. User stories are quick to write and quick to destroy, especially written on an index card. They are also feature oriented, so they can provide a good view on the real scope of a project, and we can compare them with each other in terms of size or effort.
Acceptance Ctiteria, captured for each user story, are a formalised list of requirements that ensires a user story is completed with all scenarios taken into account – it specifies the conditions under which a story is fulfilled.
Story points as a way of estimating stories, are units of measure for expressing an estimate of the overall effort required to fully implement a user story or other pieces of work on the product backlog. The team will access the effort to deliver a story against the acceptance criteria and in relation to other stories. Various proven estimation techniques can be adopted by the team for example effort can be expressed as a T-shirt size (i.e. Large, Medium, Small). To quantify the effort, each T-shirt size can be assigned a number of story points i.e. Large = 15 storypoints, Medium 5 storypoints and Small = 2 story points. (See also the section on Estimation below). The intention of using story points, instead of man hours, is to lower the risk of underestimating the scope because, story points in their nature are relative and focused on the whole scope or on a group of stories, while traditional estimation (usually done in man-hours) tries to analyse each product feature in isolation.
Definition of done is another way of building trust and common understanding about the process and all the future plans for the project. It’s usually the first time clients see user stories and while they may like the way the stories are written, it may not be so obvious what it means to implement a story. Development teams who confirm with the client their definition of done, in conjunction with the acceptance criteria with, illustrate that they know better what the client’s expectations are.Development on a story will be completed when the defenition of done is achieved. This supports better estimation. In addition on the client side, the definition of done, in conjunction with the accpetance criteria, sets the criteria for user story acceptance.
Using the above four aspects, will provide the building blocks to define the scope budget in story points. This story point budget and not the stories behind it, is the first thing that should be fixed in the contract.
This sets the stage for change.
While we have the scope budget fixed (in terms of story points) we still want to embrace change, the agile way. As we are progressing with the project delivery, and especially during backlog refinement, we have the tools (user stories and points) which we can use to compare one requirement with another. This allows us to refine stories and change requirements along the way within a defined story point budget limit. And if we can stay within that limit, we can also stay within the fixed price and time.
Before Estimation
The hardest part in preparing a fixed price contract is to define the price and schedule that will be fixed based on, in most cases, not so well-defined requirements but preferably a well defined scope.
How can you prepare the project team (customer & supplier) to provide the best possible initial estimation?
Educate: Meet with your client and describe the way you’re going to work. We need to tell what the stories are all about, how we are going to estimate them and what is the definition of done. We might even need to do that earlier, when preparing an offer for the client’s Request For Proposal (RFP). Explain the agile delivery mothodology and you will use it to derive the proposal.
Capture user stories: This can be arranged as a time-boxed sessions, usually not taking no more than 1 or 2 days. This is long enough to find most of the stories forming the product vision without falling into feature creep. At this point it is also very important to discuss the definition of done, acceptance criteria for stories, iterations and releases with the client.
We need to know:
The environment in which stories should be tested (like the number of browsers or mobile platforms, or operating systems)
What kind of documentation is required
Where should finished stories be deployed so that the client can take a look at them
What should the client do (i.e. take part in a demo session)
How often do we meet and who participates
etc.
This and probably many more project specific factors will affect the estimation and will set a common understanding about the expectations and quality on both sides. They will also make the estimation less optimistic as it often happens when only the technical aspects of story implementation are considered by the team.
Estimation
Having discussed with the client a set of stories and a definition of done, we can now start the estimation. This is a quite well-known part of the process. The most important activity here is to engage as many future team members as possible so that the estimation is done collectively. Techniques like planning poker are known to lower the risk of underestimation because of some particular team member’s point of view, especially if this team member is also the most experienced-one, which is usually the case when estimations are done be one person. It is also important that the stories are estimated by the people who will actually implement the system.
Apart from T-shirt sizes to expressed effort estiamtion, as mentioned under Story Points above, the Fibonacci-like scale (1, 2, 3, 5, 8, 13, 20, 40, 100) comes in handy for estimating stories in points. Relative estimation starts with finding a set of easiest or smallest stories. They will get 1 or 2 points as a base level for further estimation.
In fact during the initial estimation it is often hard to estimate stories using the lowest values like 1 or 2. The point is, the higher the estimation, the less we know about the story. This is also why estimating in points is easier at this early stage, because it is far easier to tell that a story A is 2x as complicated as story B than to tell that story A will take 25 man-hours to get it Done (remember the definition of done?) and the story B will take 54 hours.
This works well even if we choose 3 or 5 point stories as the base level and if we do that, then it will be easier to break them down into smaller stories later during the development phase. Beware however the stories of 20, 40 or 100 points. This kind of estimation suggests that we know nothing about what is to be implemented, so it should be discussed with the client here and now in a little more detail instead of just happily putting it in the contract.
The result of the estimation is a total number of story points describing the initial scope for a product to be built. This is the number that should be fixed in terms of scope for the contract, not the particular stories themselves.
Deriving the Price and Time
Total number of points estimated based on the initial set of stories does not give us the price and time directly. To translate story points into commercial monetory numbers we need to know more about the development team’s makeup described in the number of differently skilled resources within a team, and the team’s ability to delivery work which is expresessed in an agile KPI referred to as the Team Capacity and/or Velocity.
The team’s velocity refers to the pace, expressed in story points per development cycle or sprint, at which a team can deliver work. The team’s capacity is defined by the average number of story points the team can deliver within a development cycle or sprint. An increase in the velocity, as a result of increased efficiency and higher productivity, will over time increase the teams capacity. Understandably, changing the makeup of the team will impact the team’s velocity/capacity. The team’s capacity and velocity is established through experience on previous projects the team delivered. A mature agile team is characterised by a stable and predictable velocity/capacity.
Let’s use a simple example to demonstrate how the team makeup and velocity are used to determine the project cost and time.
Assume we have:
Estimated our stories for a total of 300 story points.
The team makeup consists of 5 resources – 3 developers, 1 tester and a team leader.
Agile Scrum will be team’s delivery methodology.
Experience has shown this teams capacity / velocity is 30 story points over development cycle or sprint length of 2 weeks.
Determine the predicted Timeline
Time = <Points> / <Velocity> * <Sprint length>
Thus…
Time = 300 / 30 * 2 = 20 weeks (or 10 sprints)
Many factors during the project may affect the velocity, however if the team we’re working with is not new, and the project we’re doing is not a great unknown for us, then this number might be actually given based on some evidence and observations of the past.
Now we may be facing one of the two constraints that the client could want to impose on us in the contract:
The client wants the software as fast as we can do it (and preferably even faster)
The client wants as much as we can do by the date X (which is our business deadline)
If the calculated time is not acceptable then the only factor we can change is the team’s velocity. To do that we need to change the teams makeup and extend the team, however this is not working in a linear way i.e. doubling the team size will nor necessarily double its velocity but it should increase the velocity as the team should be able to do more work within a development cycle.
Determine the predicted Price
Calculating the price is based on the makeup of the team and the assocaited resource/skill set rate card (cost per hour).
The teams cost per sprint is calculated by the % of time or number of hours each reasurce will spend on the project within a sprint.
For our eaxmple, let assume:
A Sprint duration of 2 weeks has 10 working days and working 8 hours per day = 80h per sprint.
Developer 1 will work 100% on the project at a rate of £100 per hour.
Developer 2 will work 50% of his time on the project at a rate of £80 per hour.
Developer 3 will also work 100% on the project at a rate of £110 per hour.
The Team Leader will work 100% on the project at a rate of £150 per hour.
The Tester will be 100% on the project at £80 per hour.
The team cost per sprint (cps) will thus be…
Resource cost per sprint (cps) = <hours of resource per sprint> * <resource rate per hour>
Developer 1 cps = 80h * £100 = £8,000
Developer 2 cps = 40h (50% of 80h) * £80 = £3,200
Developer 3 cps = 80h * £110 = £8,800
Team Leader cps = 80h * £150 = £12,000
Tester cps = 80h * £80 = £6,400
Total team cost per sprint = (sum of the above) = £38,400 per sprint
Project predicted Price = <Number of sprints (from Predicted Timeline calculation)> * <Team cost per sprint>
These simplistic calculations are of course just a part of the cost that will eventually get into the contract, but they are also the part that usually is the hardest to define. The way in which these cost are calculated also shows how delivering agile projects can be transferred into the contract negotiations environment.
Negotiating on Price
“So why is it so expensive?”, most customers ask.
This is where negotiations actually start.
The only factor a software company is able to change is its man-hour cost rate. It is the rate card that we are negotiating. Not the length of our iteration, not even the number of iterations. Developers, beyond popular believe, has no superhero powers and will not start working twice as fast just because it is negotiated this way. If we say we can be cheaper it is because we will earn less not because we will work faster.
The other factor that can influence the price is controlled by the customer – the scope.
Tracking Progress and Budget
Now that we have our contract signed, it is time to actually build the software within the agreed constraints of time and budget.
Delivering your fixed price project in an agile way is not a magic wand that will make all your problems disappear but it if measured correctly it will give you early visisbility. That is where the project metrics and more specific the burndown graphs come in to play. Early visibility provides you with the luxury of early corrective action ensuuring small problems do not turn into large expesive one’s.
One such a small mistake might be the team velocity used when the project price was calculated. Burndown charts are a very common way of tracking progress in many agile projects. It shows the predicted/forecasted completion of work rate (velocity) against the actual velocity to determine if the project is on track.
Figure 1 – Planned scope burndown vs. real progress.
They are good to visualize planned progress versus the reality. For example the burndown chart from Figure 1 looks quite good:
We are a little above the planned trend but it does not mean that we made a huge mistake when determining our velocity during the contract negotiations. Probably many teams would like their own chart to look like this. But the problem is that this chart shows only two out of three contract factors – scope ( presented as a percentage of story points) and time (sprints). So what about money?
Figure 2 – Scope burndown vs budget burndown.
The chart on Figure 2 shows two burndowns – scope and budget. Those two trends are expressed here as percentages for the purpose. There is no other way to compare those two quantities calculated (one in story points and the other in man-hours or money spent).
To track the scope and budget this way we need to:
Track the story points completed (done) in each iteration.
Track the real time spent (in man-hours) in each iteration.
Recalculate the total points in your project into 100% of our scope and draw a burndown based on percentage of the total scope.
Recalculate the budget fixed in the contract (or its part) into a total available man-hours – this is our 100% of a budget – and draw a budget burndown based on percentage of the total budget usedto date.
The second chart does not look promising. We are spending more money to stay on track than we expected. This is probably because of using some extra resources to actually achieve the expected team’s velocity. So having all three factors on one chart makes problems visible and iteration (sprint) 4 in this example is where we start to talk with the client and agree on mitigating actions, before it is too late.
Embracing Change
Agile embraces change, and what we want to do is to streamline change management within the fixed price contract. This has always been the hard part and it still is, but with a little help through changing the focus from the requirements analysis into some boundary limits early in the process, we want to welcome change at any stage of the project.
Remember earlier in the process changed fixed scope into fixed budget. The 300 story points from the example allows us to exchange the contents of the initial user story list without changing the number of story points. This is one of the most important aspects that we want to achieve with a fixed price contract done the agile way.
The difficulty here is to convince the client that stories can be exchanged because they should be comparable in the terms of effort required to complete them. So if at any point client has a new great idea that we can express as some new set of stories (worth for example 20 points) then it is again up to the client if we are going to remove stories worth 20 points from the end of our initial backlog to make a place for the new ones.
Or maybe the client wants to add another iteration (remember the velocity of 30 points per iteration?). It is quite easy to calculate the price of introducing those new stories, as we have already calculated the cost of a sprint.
What still is the most difficult in this kind of contracts is when we find out during the project that some stories will take longer than expected because they were estimated as epics and now we know more about them than we did at the beginning. But still this might not always be the case, because at the same time some stories will actually take less. So again tracking during the contract execution will provide valuable information. Talking about the problems earlier helps negotiating as we can talk about actions that need to be taken to prevent them instead of talking about the rescue plans after the huge and irreversible disaster.
Earning Mutual Trust
All the techniques discussed, require one thing to be actually used succesfully with a fixed price contract and that is – trust. But as we know, trust is not earned by describing but by actually doing. Use the Agile principles to demonstrate the doing, to show the progress and point out the problems early.
With every iteration we want to build value for the client. But what is more important, we focus on delivering the most valuable features first. So, the best way to build the trust of a client might be to divide the contract.
Start small, with some pilot development of 2 or 3 iterations (which will also be fixed price, but shorter). The software delivered must bring an expected value to the client. In fact it must contain some working parts of the key functionalities. The working software proves that you can build the rest. It also gives you the opportunity to verify the first assumptions about the velocity and eventually renegotiate the next part.
The time spent on the pilot development, should also be relatively small when compared to the scope left to be done. This way if our clients are not satisfied with the results, they can go away before it is too late and they no longer need to continue the contract and eventually fail the project.
Summary
Fixed price contracts are often considered very harmful and many agile adopters say that we should simply avoid them. But most of the time and as long as customers request them, they cannot be avoided, so we need to find ways to make them work for the goal, which is building quality software that can demonstrably increase business value propositions and competitive advantage.
I believe that some aspects of a fixed price agile contract are even good and healthy for agile teams, as it touches on the familiar while instilling commercial awareness. Development teams are used to working with delivery targets and business deadlines. That is exactly what the fixed date and price in the contract are – healthy time boxes and boundaries keeping us commercially aware and relevant.
Keep the focus on scope and you can still deliver your agile project within a fixed time and budget.
The intention of this article was not to suggest that agile is some ultimate remedy for solving the problem of fixed price contracts but to show that there are ways to work in this context the agile way.
Sep ’19 – The latest version of Ambit Enterprise software have been deployed for Shawbrook Bank’s Business Finance division.
As Programme Director, Renier was responsible for managing the integration and delivery, software development and implementation of the Enterprise version of Ambit for 15 specialist asset-finance business units and their associated product offerings.
Ambit Asset Finance Software meets its customer’s diverse set of requirements by not only bringing to market scalable, flexible, and industry-leading software solutions, but delivering and supporting these applications in fully managed and hosted environments.
Statistics indicate that 68% of all IT projects are bound to failure!
The PMI’s definition of a high-performing organisation, is a company that completes 80% or more projects on time, on budget, and meeting original goals. In a low-performing organization, only 60% or fewer projects hit the same marks.
Projects fail for all kinds of reasons:
Stakeholders can change their objectives
Key team members can leave for other companies
Budgets can disappear
Materials/Vendors can be delayed
Priorities can go un-managed
Running out of time
…and others
In this post:
> How to prevent project failure (with some statistics)
> How to recover a failing project
How to prevent project failure
Prevention is the best cure, so what can you do to prevent projects from failing? Here is some statistics…
Organisations that invest in proven project management practices waste 28 times less money because more of their strategic initiatives are completed successfully.
Source: PMI’s Pulse of the Profession Survey, 2017.
77% of high-performing organizations have actively-engaged project sponsors, while only 44% of low-performing organizations do.
Source: PMI’s Pulse of the Profession Survey, 2017.
46% of CIOs say that one of the main reasons IT projects fail is weak ownership.
Source: The Harvey Nash/KPMG CIO Survey, 2017.
33% of IT projects fail because senior management doesn’t get involved and requirements/scope change mid-way through the project.
Source: A Replicated Survey of IT Software Project Failures by Khaled El Emam and A. Güneş Koru, 2008.
78% of respondents feel that business is out of sync with project requirements and business stakeholders need to be more involved in the requirements process.
Source: Doomed from the Start Industry Survey by Geneca, 2011.
Companies that align their enterprise-wide PMO (project management office) to strategyhad 38% more projects meet original goals than those that did not. They also had 33% fewer projects deemed failures.
Source: PMI’s Pulse of the Profession Survey, 2017.
40% of CIOs say that some of the main reasons IT projects fail is an overly optimistic approach and unclear objectives.
Souce: The Harvey Nash/KPMG CIO Survey, 2017.
Poor estimation during the planning phase continues to be the largest (32%) contributor to IT project failures.
Source: PwC 15th Annual Global CEO Survey, 2012.
Projects with effective communication are almost twice as likely to successfully deliver project scope and meet quality standards than projects without effective communication (68% vs 32% and 66% vs 33%, respectively.)
Source: PwC 15th Annual Global CEO Survey, 2012.
How to recover a failing project
These statistics show that the odds are not in your favour. It is inevitable that you will have to deal with a failing project or two, some time within your career… You could turn the odds in your favour by taking action in recovering failing projects.
Here are four steps you can use that could save a failing project — backed up by original research from Gartner, iSixSigma, PMI Project Zone Congress, The Institution of Engineering and Technology, and GovernmentCIO Magazine. Follow these four steps and salvage your failing project!
Step 1: Stop and Evaluate
Step 1 – Big action items:
Issue a “stop work” order
Talk with everyone
Metrics/Indicators: The right project Management Information (MI) should give you the needed early warning signs when things are not going according to plan and heading to failure. These signs should drive you to action, as rescuing a failing a project is not a task to be sneezed at. It takes planning, and the process can consume weeks of key resources time and effort.
People: To help ease the pain of stopping a project, work with the team members’ managers (resource owners) to identify and assign interim work. As people are your most important asset, it is important to keep them productively engaged while you are evaluating and re-planning your project recovery.
Project artefacts/deliverables: Make sure all the project artefacts and deliverables are safely stored where it cannot be tampered with for the interim period.
Communicate: (clear, concise, and concrete) – Communicate to your team why their project is on hold. Spend the needed time to learn as much as you can about each team member’s opinions of the project and of each other. Learning that their project will be put on hold will inevitably create distrust. Transparency and tailored messaging is the best way to mitigate bad feelings. See blog posts “Management Communication Plan” and “Effective Leadership Communication”
Project/Delivery Manager (You):Check your ego. Go to the major stakeholders and ask for anonymous feedback on their view of the overall project. When evaluating their responses, don’t forget to consider company culture and politics and how those factors may have played a role in forming the stakeholders’ opinions.
Step 2: Why your project is failing – Root causes
Step 2 – Big action items:
Establish allowable solutions for project rescue (including project termination)
Identify root causes of the problem
Identify risks to project continuation
Determine the root causes: Most times the cause of project problems is not immediately obvious. Even the best project managers — those with excellent project plans, appropriate budgets, and fantastic scope control — also struggle, on occasion, with project failure.
You’ll only get to the bottom of it by doing a Route Cause Analysis (RCA) and the “5 Why’s” technique can help with that. See “The 5 Whys for route cause analysis”
Surface-level answers are often the temptation when project managers reach this step. They might focus on the complexity of their project, their outdated project management softwareor methodology, their unclear objectives or their stakeholders’ lack of involvement. All of these problems are so generic that they don’t provide enough insight to create real solutions.
Apply the “5 Whys” and be specific when answering these questions… i.e.
Why are objectives unclear?
Why aren’t users getting involved?
Why are the estimates wrong?
Of course, some of these answers may be hard to hear, and solutions can range from the challenging to impossible. Remember: if these issues could be easily remedied, they would have been addressed and resolved. Even simple problems — like a team member leaving — can take months to fix. Ask yourself: are you using the right technology for the job? Are your dependencies so external that project control is simply out of your hands?
If you’re still struggling to figure out where the root of your project failure is, consider these seven issues – the most common causes of project failure.
Complexity
External
Financial
Operational
Organizational
Schedule
Technology
Risk Assessment:What are the risks when trying to salvage the project? Are those risks worth it? Is the project salvageable? Answer these questions before moving on.
Step 3: War Room
Step 3 – Big action items:
Set up the war room
Re-engage stakeholders
Create a tentative plan to move forward
Okay, General!
Assemble the team, seat them all together, and work through a rescue workshop. You’re in the mentality of “kill” or “fix” you’re done fact finding, asking question for further research, or finding other excuses to delay the process. That should all have been done in step two. You’re focussed to figure out what to do with your project.
The “war room” will be intense – all members need to be prepared and the right mindset of problem solving!
The decision-making process could take two hours or several days. All key decision makers must be present. As this is not always possible some executives may prefer to be called in as the meeting is nearing its end, where team members can present prepared options.
To get the most out of the workshop, conduct the meeting face to face (take the meeting offline). Try to limit the meeting to ten people, including the most important stakeholders (like the sponsors), project manager, senior team members including technical representative to give insight to plan feasibility.
The war room is serious business – prepare for it. Create an agenda to go over findings, from quantitative reporting to team member interviews. Encourage pre-war-room collaboration (covering the outcomes of steps 1 and 2) toward the ideal shared result.
When you start the war room meeting, all project material should be readily available. That’s your fact base driving factual data driven assumptions and decisions.
Using the facts, the purpose of the war room, in essence, is to answer three deceptively complex questions:
Is the business case still valid?
If the business case is no longer valid, is there potential for a new, reimagined, justified business case?
(If so): Are the added costs for project rescue worth it?
Encourage your task force to focus on identifying the project’s primary drivers (i.e. business need/value, budget, schedule, scope, or quality). Ideally, there should only be one driver that controls the outcome of the project – this is usually the business need for the project’s deliverables.
Sometimes the primary driver is beyond repair. For example, if the core due date has passed and it was aligned with a market cycle (ex: Black Friday to Christmas), then the project is irremediable.
Least case scenario: Clearly articulate the primary goal. Then identify what the team can do with the least amount of effort. Develop a scenario that costs the company the least and gets closest to achieve the primary goal.
Project termination considerations: If the primary goal cannot be achieved, prepare a recommendation to terminate the project… but not without scrutiny. Several variables must be considered and thoroughly addressed in the war room.
Consider trade-offs that could make the worst-case scenario more possible than originally thought.
Think about the potential backlash from killing a project.
How does that decision affect business strategy?
Other projects?
Public perceptions?
Potential future clients? All these variables must be considered and thoroughly addressed in the war room.
Alternatives: Should the least-case scenario makes sense, explore more alternatives. Are there alternative options that can deliver more of the project’s objectives, and consider how adding those solutions to your plan can create additional potential scenarios — positive or negative.
New project charter: Write down the main points of your plan in a revised project charter.
Replacement project option: It’s not uncommon for stakeholders to propose a replacement project instead of a rescue. That’s a totally viable option — kill the project, salvaging only essential, functional portions of the original attempt, and work to create a new plan.If the decision is to completely start over, abandon project rescue altogether. Justify the replacement project on its own merit (a new scope, budget, resource plan, etc.)
Step 4: Set your project in motion
Step 4 – Big action items:
Finalise how your project will move forward
Confirm responsibilities
Reset organizational expectations.
Following your war room meeting, your next steps are all about follow-up. The real project rescue starts here and is the most challenging part of project rescue.
Re-engage stakeholders around the contents of the new project plan and complete the detail with precise commitments for each team member. Plans should be finalised within two days.
Be careful as hesitation and procrastination can limit team commitment and lower morale. You’re the general; get your troops ready to re-engage and to stay committed and focussed!
Reconfirm all project metrics: Validate all project aspects especially resources, as people has been allocation to productive work while you were reworking your rescue plan.
As the project rolls forward, be sure to detail the new project’s profile, scope, and size to the core team and beyond. Emphasize expected outcomes and explain how this project aligns with the company’s goals. Don’t shy away from communicating what these changes can mean on a big-picture scale. While you may receive some feedback, be direct: the project is proceeding.
Make sure all communication is clear. Confirm that stakeholders accept their new responsibilities to the project.
AGILE – What business executives need to know #2: Overview of 4 most commonly used Agile Methodologies
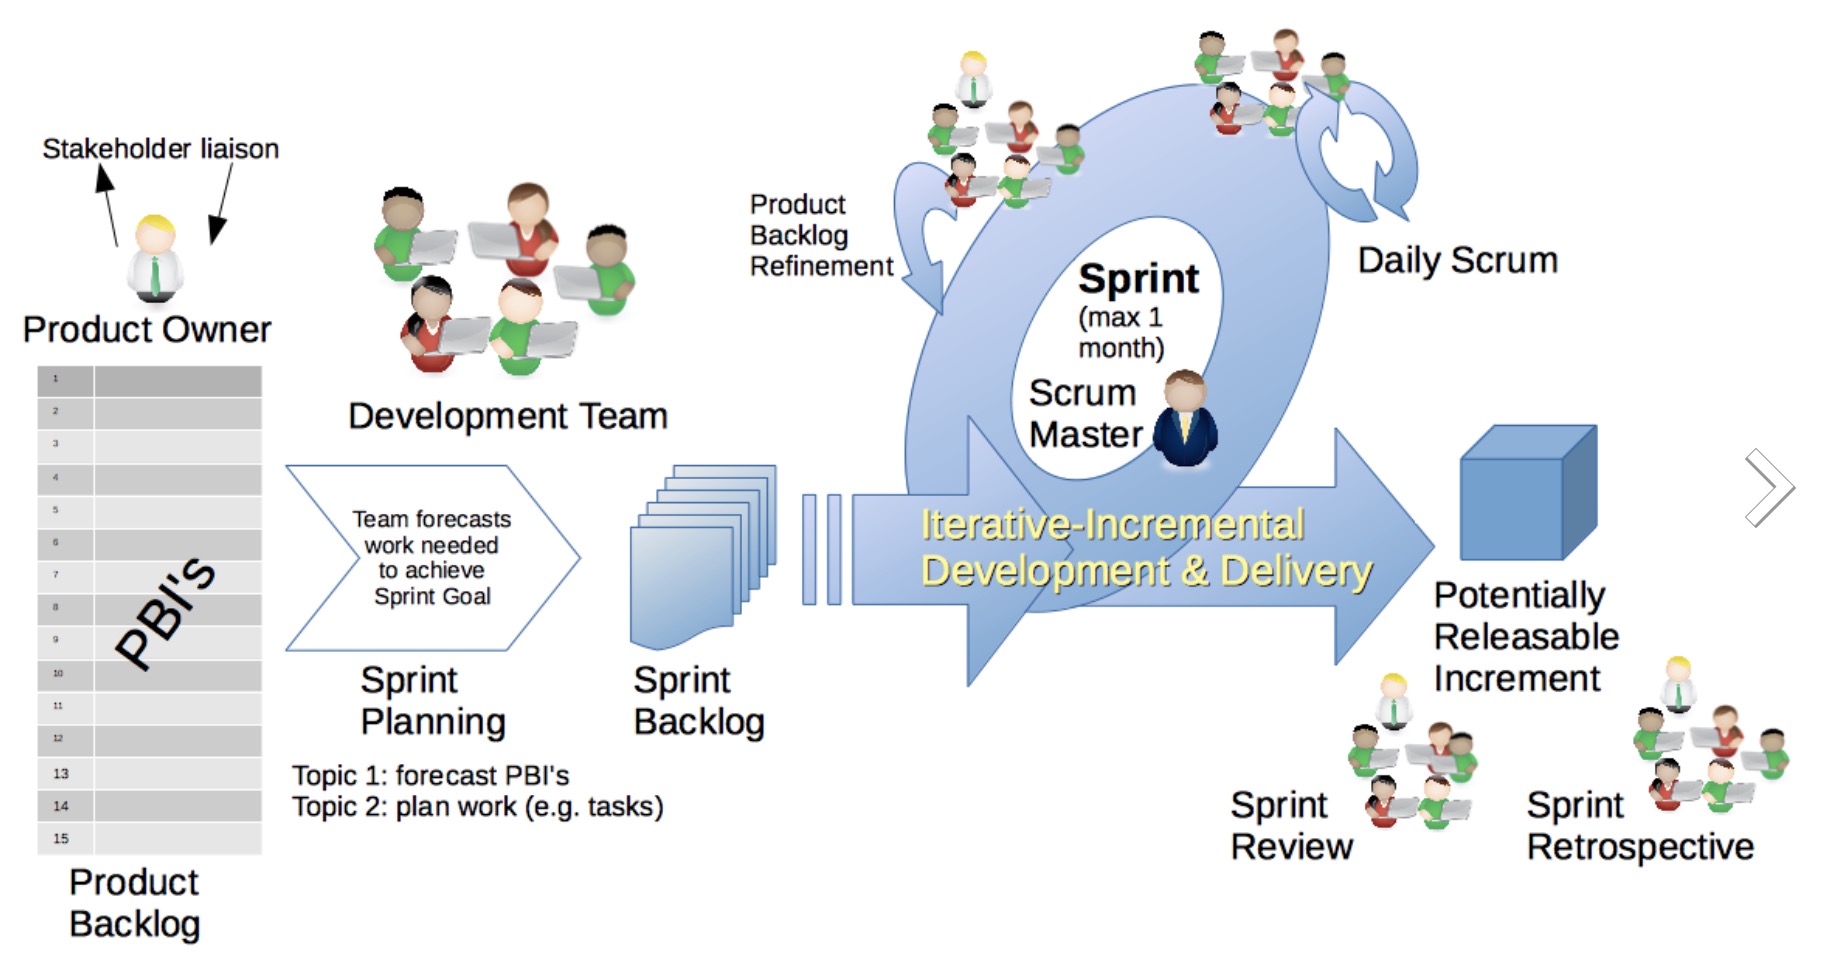
In the first article in this series we focussed on an overview of what Agile software development is and referred to the Agile SCRUM methodology to describe the agile principles.
Let’s recap – Wikipedia describes Agile Software Development as an approach to software development under which requirements and solutions evolve through the collaborative effort of self-organizing cross functional teams and their customers / end users. It advocates adaptive planning, evolutionary development, early delivery, and continuous improvement, and it encourages rapid and flexible response to change. For an overview see the first blog post…
Several agile delivery methodologies are in use for example: Adaptive Software Development (ASD); Agile Nodelling; Agile Unified Process (AUP); Disciplined Agile Delivery; Dynamic Systems Development Method (DSDM); Extreme Programming (XP); Feature-Driven Development (FDD); Lean Software Development (LEAN); Kanban; Rapid Application Development (RAD); Scrum; Scrumban.
This article covers a brief overview of the four most frequently used Agile Methodologies:
Scrum
Extreme Programming (XP)
Lean
Kanban
SCRUM
Using Scrum framework the project work is broken down into user stories (basic building blocks of agile projects – these are functional requirements explained in an in business context) which are collated in the backlog (work to be done). Stories, from the backlog, are grouped into sprints (development iteration) based on story functionality dependencies, priorities and resource capacity. The resource capacity is determined by the speed (velocity) at which the team can complete stories, which are categorised into levels of complexity and effort required to complete. Iterations are completed with fully functional deliverables for each story until all the needed stories are completed for functional solutions.
Scrum is based on three pillars:
Transparency – providing full visibility on the project progress and a clear understanding of project objectives to the project team but more importantly to the stakeholders responsible for the outcome of the project.
Inspection – Frequent and repetitive checks on project progress and milestones as work progresses towards the project goal. The focus of these inspections is to identify problems and differences from the project objectives as well as to identify if the objectives have changed.
Adaptation – Responding to the outcome of the inspections to adapt the project to realign in addressing problems and change in objectives.
Through the SCRUM methodology, four opportunities for Inspection and Adaptation are provided:
Sprint Retrospective
Daily Scrum meeting
Sprint review meeting
Sprint planning meeting
A Scrum team is made of a Product Owner, a Scrum Master and the Development Team.
Scrum activity can be summarised within the following events:
Sprint – a fixed time development iteration
Sprint Planning meetings
Daily Scrum meetings (Stand-Up meetings)
Sprint Review meetings
Sprint Retrospectives
XP – EXTREME PROGRAMMING
Extreme Programming (XP) provides a set of technically rigorous, team-oriented practices such as Test Driven Development, Continuous Integration, and Pairing that empower teams to deliver high quality software, iteratively.
LEAN
Lean grew from out of the Toyota manufacturing Production System (TPS). Some key elements of this methodology are:
Optimise the whole
Eliminate waste
Build quality in
Learn constantly
Deliver fast
Engage everybody
Keep improving
Lean five principles:
Specify value from the customer’s point of view. Start by recognizing that only a small percentage of overall time, effort and resources in a organization actually adds value to the customer.
Identify and map the value chain. This is the te entire set of activities across all part of the organization involved in delivering a product or service to the customer. Where possible eliminate the steps that do not create value
Create flow – your product and service should flow to the customer without any interruptions, detours or waiting – delivering customer value.
Respond to customer demand (also referred to as pull). Understand the demand and optimize the process to deliver to this demand – ensuring you deliver only what the customer wants and when they want it – just in time production.
Pursue perfection – all the steps link together waste is identified – in layers as one waste rectification can expose another – and eliminated by changing / optimizing the process to ensure all assets add value to the customer.
KANBAN
Kanban is focussed the visual presentation and management of work on a kanban board to better balance the understanding of the volume of work with the available resources and the delivery workflow.
Six general work practices are exercised in kanban:
Visualisation
Limiting work in Progress (WIP)
Flow management
Making policies explicit
Using feedback loops to ensure customer and quality alignment
Collaborative & experimental evolution of process and solutions
By limiting WIP you are minimising waste through the elimination of multi tasking and context switching.
There is no prescription of the number of steps to follow but it should align with the natural evolution of the changes being made in resolving a problem or completing a specific peace of work.
It focuses on delivering to customer expectations and needs by promoting team collaboration including the customer.
A Pragmatic approach
These techniques together provide a powerful, compelling and effective software development approach that brings the needed flexibility / agility into the software development lifecycle.
Combining and borrowing components from different methodologies to find the optimum delivery method that will deliver to the needs of the organisation is key. Depending on the specific business needs/situation, these components are combined to optimise the design, development and deployment of the software.
Helpful references:
A good overview of different agile methodologies can be found on this slideshare at .
Let’s Talk – Are you looking to achieve your goals faster? Create better business value? Build strategies to improve growth? We can help – make contact!
SPHERE grows – delivering IT Shared Services to West Middlesex University Hospital NHS Trust
SPHERE, Systems Powering Healthcare Ltd, is incorporating West Middlesex University Hospital NHS Trust into the shared IT service provision that they supply to a number of NHS Trusts. This includes Chelsea & Westminster Hospital NHS Foundation Trust, which acquired West Middlesex in 2015.
The project results from several months of preparatory work by SPHERE, assessing its scope and provisioning the service transfer, with completion scheduled for October 2017.
SPHERE is an IT shared services provider to the healthcare sector, primarily NHS Foundation Trusts. It was set up by Chelsea and Westminster and the Royal Marsden NHS Foundation Trusts to deliver and support IT infrastructure for both trusts to achieve economies of scale and bring down the cost per user, says Renier Botha, Managing Director of SPHERE:
“Chelsea and Westminster NHS Foundation Trusts is one of the founding members of SPHERE and it made sense for the West Middlesex Trusts to join the shared services management that we provide. We have a proven services model that we can take to a range of other healthcare providers to realise cost savings whilst improving service quality.
“SPHERE will now be supporting an additional 2,000 end users with the commissioning of West Middlesex. This financial year will see the cost per user for member trusts fall substantially through economies of scale,” says Renier Botha.
SPHERE is currently gearing up to support the deployment of the Cerner EPR (Electronic Patient Record) system across the Chelsea Westminster and West-Middlesex NHS Trusts for which it provides shared services.
West Middlesex will be the first Trust to go live with Cerner. Sphere will manage the provision of infrastructure and the overall IT support services and are currently assessing which first line support services will be prioritised for the Cerner platform.
In 2014 Kevin Jarrold, Director on the SPHERE board and CIO at Imperial Healthcare Trust and Chelsea and Westminster, oversaw the deployment of Cerner at Imperial. Sphere will look to capitalise on the learnings of the Imperial team to ensure trouble-free integration of the support services.
To take advantage of the capabilities of cloud computing, SPHERE is moving its primary data centre and specific systems to Equinix, a leading colocation provider, in London.
Equinix has hosted the Cerner platform since 2010 and SPHERE says that this offers a robust solution for the Trusts, improving the IT infrastructure resilience and business continuity capabilities mitigating the key business risks associated with location and services required from IT hosting facilities.
“SPHERE is well positioned to provide improved IT services to the healthcare sector – expanding on the presence of Cerner within the same data centre and utilising the capabilities of the Microsoft Azure cloud platform at Equinix,” says Renier Botha.
For further information please contact SPHERE Head Office – Systems Powering Healthcare Ltd, Unit 101, Harbour Yard London, SW10 0XD – Tel: 020 331 5888.
Consulting to Cloud Troopers as the Interim Head of Loyalty Products & Programmes – Renier directed the design, software development and implementation of the points based Allegiant Airlines Loyalty and Rewards Programme to fully leverage the Allegiant services and brand strength to provide new revenue streams and increase the effectiveness of others. The Allegiant Rewards programme is based on a co-branded credit card provided by an American Bank.
Guest Blog by Brian Sumers – 1 Sep 2016
Allegiant Air knows less about its most loyal customers than it would like. Its new co-branded credit card could help change that. But will anyone apply for it?
Despite being among the world’s most consistently profitable airlines, Allegiant Air knows relatively little about its customers, though it has learned, through surveys and from Mastercard that they have an average household income slightly above $100,000 and prefer to eat at Olive Garden and shop at TJ Maxx.
The problem is that Allegiant’s customers fly the airline infrequently, with about 80 percent booking one or two tickets per year. And since Allegiant has not had a frequent flyer program, it has fewer opportunities than other airlines to learn about its customers.
But Allegiant, which has reported 53 consecutive profitable quarters, believes it has finally solved its problem. Almost two decades after its first flight, the airline on Thursday launched a co-branded credit card — a Bank of America Mastercard — the first for Allegiant, a niche carrier that prefers routes other airlines avoid, such as St. Cloud, Minnesota to Phoenix, Minot, North Dakota to Las Vegas and Belleville, Illinois to Jacksonville. Allegiant will enter a market saturated with travel-themed cards from nearly every airline and hotel company, but it is hopeful the new card will give it more insights into its passengers.
“I am surprised it has taken them this long,” said Jay Sorensen, president of IdeaWorks Company and an authority on airline ancillary revenue schemes. “But what is unique about Allegiant is their base of business is probably very distinct from the traditional airlines. It is an interesting position.”
“We think it is going to be valuable piece of business,” said Brian Davis, Allegiant’s vice president for marketing and sales, declining to give exact numbers. “We see our peers and the revenue generated from programs like this.”
The card comes as Allegiant, long an iconoclast in the U.S. airline industry, starts to look more like its competitors, all of whom have long had co-branded credit cards and loyalty programs. Allegiant, which had bought only used planes, recently placed its first order for new aircraft from Airbus. And, despite mostly flying between small and medium sized markets for most of its history, Allegiant is expanding at larger ones, including Newark, New Jersey. It is even starting to compete with larger airlines on some routes after having long avoided direct competition.
Still, with its co-branded credit card, Allegiant is trying something different. Unlike every other U.S. airline, Allegiant will not award points for travel. Instead, only card-holders, who will pay a $59 annual fee, will earn them. They’ll receive three points for each dollar they spend on Allegiant, two for spending on dining, and one for all other purchases. They can use points for discounts on travel, and the 15,000 points that come as a sign-up bonus can be redeemed for $150 off the price of any ticket. As sweeteners, cardholders receive a free drink when flying Allegiant, as well as discounts on hotel packages. (Allegiant hopes this will help it sell more packages.)
There’s no chance for travelers to redeem for business class airfare to Asia, but Davis said Allegiant’s customers have little interest in complicated redemption schemes.
“Those are built around travelers who travel a ton, and it is worth their time to learn about the rules,” he said. “If you only travel once a year, you’re not going to tolerate a lot of rules and conditions.”
Monitoring customer habits
When card members start spending, Allegiant will have access to more data about its core customers. Bank of America will not share information about individuals, but it will give the airline macro-level insights it does not have today.
“To the extent that people use it as their primary card, you have opened up the window to a lot more data,” Sorensen said. “That data can include, ‘Are they buying products from your competitors? And where are they using the card?”
This is a big deal for Davis. If a customer books a ticket using any credit card on Allegiant, he can learn some details about where else those customers shop, but a branded credit card will give Allegiant access to more aggregate data about what key customers want.
“If through this card, we learn our customers have a really strong affinity for a particular chain of restaurant, then I hope in the next year or two I would hope we would reach out to that restaurant chain about a [tie-in,]” Davis said.
Sorensen said an airline can use data to tailor offers to customers. Allegiant makes considerable revenue on vacation packages, but presumably many of its customers buy hotels independently on Orbitz or another site. If Allegiant can learn more about where its card-holders are staying, it will know more about which hotels to show in prominent positions on its website.
Allegiant also expects to use the card to maintain a year-round relationship with its most loyal customers. Today, it emails customers with deals, but it wants to have other reasons to contact them.
“For the first time, many customers will have a reason to stay connected with us for the other 51 weeks of the year,” Davis said. The goal is to “expand the company’s relationship” with customers, he said.
A challenge to attract card members
Many airlines first start a frequent flyer program and then add a credit card. They create the programs in this order because a carrier with millions of customers in a database has a natural market for its cards.
“It will be a handicap,” Sorensen said. “A general rule of thumb is that once you have a million or more people in a frequent flyer program, then you can start talking to a bank.”
But Allegiant expects to have something other airlines do not — motivated flight attendants. On every flight, they will make announcements and give out paper applications. They will ask passengers to fill them out and will collect them before landing. The on-plane collection is important, Davis said, because the airline fears customers will forget to mail them in.
With the card, Allegiant expects to the same people who buy the bulk of the airline’s tickers — the female head-of-householders. The airline says its core customer is Christie, 48, a married former school teacher with two kids living in Sioux Falls, South Dakota. Her husband is co-owner of the local insurance company. “Christie has always been in charge of booking vacations for the family and hates wasting time and money,” Allegiant says in internal documents.
Ultimately, though, the card’s success may on how aggressively flight attendants sell it. Other airlines also ask flight attendants to promote cards with limited success, but Allegiant is optimistic its employees, who already earn commissions for other on-plane sales, will be motivated. The flight attendant responsible for each credit card approval will receive a $30 commission.
“At legacy airlines, there is almost always pushback,” Sorensen said. “Flight attendants say, ‘We’re not sales people.’ Hopefully, Allegiant is an airline where the flight attendants understand they are sales people.”
“GHA Discovery is an innovative program created to recognise and reward guests who embrace our dynamic collection of hotel brands across the globe. We require communications that reflect our unique position, cater to member preferences, and deliver an engaging experience. ICLP has been a great support in launching and running a communication platform across both email and print mediums, proving to be a dedicated partner to our company. ”, KRISTI GOLE, LOYALTY MARKETING MANAGER, GLOBAL HOTEL ALLIANCE
“BusinessClub has provided us with a valuable programme with usable member data capture, allowing greater customer insight and behavioural analysis. ICLP’s support from the design and planning of the programme through to the ongoing day-to-day management has proven to be invaluable.”, KAREN FORREST, BUSINESS MARKETING MANAGER EUROPE
iRedeem is an online redemption programme enabling members of a loyalty or membership programme to spend their loyalty currency on a range of exciting travel, lifestyle and leisure rewards.
Built on leading e-commerce technology and with a network of global partners iRedeem currently serves blue chip companies across the globe, offering them a personalised customer experience. You can incorporate your own inventory to provide greater redemption choice and reduce distressed inventory.
As a world-leading silicon component manufacturer, our client is entirely dependent on 3rd party multi-national Original Equipment Manufacturers (OEMs), systems integrators and channel resellers to manufacture, market and sell finished products to end customers. Their Channel Partner Programme creates a relationship between the Company and its independent global channel partner community…
Estimation is an essential part of any project methodology. Estimation is used for a number of purposes:
To justify the project enabling the costs to be compared with the anticipated benefits and to enable informed comparisons to be made between different technical or functional options.
To enforce the discipline needed to make the project succeed.
To secure the resources required to successfully deliver the project.
To ensure that the support impact of the project is fully understood.
To inform and improve the software development process.
What is estimation and why is it so important
Projects are planned and managed within scope, time, and cost constraints. These constraints are referred to as the Project Management Triangle. Each side represents a constraint. One side of the triangle cannot be changed without impacting the others. The time constraint refers to the amount of time available to complete a project. The cost constraint refers to the budgeted amount available for the project. The scope constraint refers to what must be done to produce the project’s end result.
These three constraints are often competing constraints: increased scope typically means increased time and increased cost, a tight time constraint could mean increased costs and reduced scope, and a tight budget could mean increased time and reduced scope.
What are the challenges
Lack of communication between…a…b…c
Lack of training in basic knowledge and techniques of estimation
Inability to do estimations based on – cost – time – scope
Project failure through time over runs and faulty estimation
Where are we going wrong?
Every day, project managers and business leaders make decisions based on estimates of the dynamics of the project management triangle.
Since each decision can determine whether a project succeeds or fails, accurate estimates are critical.
Projects launched without a rigorous initial estimate are five times more probable of experiencing delays and cancellations.
Even projects with sound initial estimates are doomed if they are not guided by informed decisions within the constraints of the triangle.
If you are working under a fixed budget (cost constraint), then an inaccurate estimate of the number of product features you can produce (scope) within a fixed period of time (schedule) will doom your project.
Inaccurate estimates across your projects de-optimize your portfolio.
Estimates are always questioned when estimates are given with knowledge – no estimation template is being used
How can we improve?
Outsource the project estimation function to an outside qualified consultant for each project to be able to gain viable and realistic project estimations that can be achieved.
Education of in-house project managers and technical leads so that we are able to collectively able to provide clear methodologies on how to estimate accurately.
This can be done through an onsite workshop/course – onsite is cost effective as company will pay one block fee for the attendees instead of delegates going offsite and attending a workshop where individual fees are applicable.
My personal recommendation is option B – as this option will allow us to retain skills in house to be able to produce accurate estimates
What are the long term benefits
Well crafted estimate creates many benefits:
alignment between business objectives and technical estimates
more informed business decision making
reliable project delivery dates
improved communication between management and the project team
controlled project costs, and
satisfied customers
Conclusion
The UK is facing ever tightening economic restraints. This means the quality of work is now, more than ever, of the utmost importance. To stay competitive in a shrinking marketplace, this company cannot afford to get a reputation in the industry for non-performance and bringing in projects over budget and outside estimated time frames. Credibility is the basis on which we build our reputation. In the eyes of clients credibility = successful projects. For us the success of all projects rest on the correct and precise estimation from the start of a project based on best practices, realistic expectations and transparency.


/filters:no_upscale()/articles/agile-team-fixed-price-contract/en/resources/image1.png)
/filters:no_upscale()/articles/agile-team-fixed-price-contract/en/resources/1image2.png)