Cash Flow Statement

The Cash Flow Statement shows how successful cash is managed within a business. It tracks how much cash is received and paid out for the particular period of the statement. It is important to understand that the Cash Flow Statement reflects only the movement of cash and shows the cash amounts that have moved up (increased) or down (decreased).

Depends on the Cash Flow item tracked showing a upwards/increase or downwards/decrease movement, can the Cash Flow value be positive if cash is increased or negative if cash is decreased.

The Cash Flow Statement usually shows the tracking of cash movement in three distinct sections:

  • Operating Cash Flow (Operational Cash Flow)
  • Cash Flow before Financing 
  • Cash Flow from Financing

A business with a positive overall cashflow (OCM) is a healthy business.

CashFlow-F1

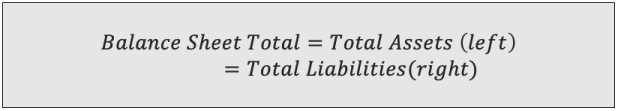
In the Book “What the Numbers Mean“, Renier provides a detailed overview of the three financial statements that makes up the set of business accounts. With the Income Statement, The Balance Sheet and Cash Flow Statement you have a full picture of the financial performance and well being of an organisation. The Income Statement (P&L) shows you the profit within an accounting period but profit is not cash and profit does not pay debt only cash does. The Balance Sheet shows you the activities linked to asset investment but does not show how cash rich a business is. The Cash Flow statement is key in linking up the P&L and Balance Sheet from a cash perspective. Cash is the hard currency of business – Cash is King!

What-the-numbers-mean-1

You can obtain a copy of the book “What the Numbers Mean” from LeanPub here…

LeanpubLogo1200x610_300ppi


Also Read…

Advertisement

Balance Sheet

The Balance Sheet is a snapshot in time showing everything the business owns – its assets – and everything a business owes – its liabilities at a specific time.

It reflects the financial status of the organisation at the close of business on a specific day. When reading the balance sheet the date is very important in the interpretation of the financials as the time of the year might impact how good the balance sheet looks for example at the end of a sales promotion.

Balance sheets are usually drawn up at the end of a month or once a year – at the end of a financial year.

The balance sheet is divided into a left and right side. The totals of the left side (Total of Assets) is equal to the total of the right side (Total of Liabilities + Shareholder Funds), hence it being called the balance sheet.

BalanceSheet-F1

The balance sheet reflects the financial information in three very specific sections namely:

  • Assets – what the business owns
    • Fixed Assets – also referred to as Long Term Assets
    • Current Assets – also referred to as Short Term Assets
  • Liabilities – What the business owes
    • Fixed Liabilities – also referred to as Long Term Liabilities
    • Current Liabilities – also referred to as Short Term Liabilities
  • Shareholder’s Funds– the money invested in the business by its shareholders or owners, also referred to Owners Funds or Equity.

BalanceSheet-F2


In the Book “What the Numbers Mean“, Renier provides a detail overview of the financial records reflected in each of the three sections within the Balance Sheet.  He also covers the relation between the Balance Sheet and The Income Statement and concepts like “Goodwill”, “Bad Debt” and stock valuation concepts based on “FIFO” and “LIFO”.

What-the-numbers-mean-1

You can obtain a copy of the book “What the Numbers Mean” from LeanPub here…

LeanpubLogo1200x610_300ppi

Also Read…

Profit & Loss (P&L) or Income Statement

The Income Statement, also referred to as the Profit and Loss (P&L) account, reflects the earnings of a company.

P&L_F1

Earnings are the net outcome of a company’s operations and are the amount on which corporate tax is due, also referred to as Profit (which are reflected as six different profit levels within the Income Statement).

Revenue (also known as income, sales or billings) is the income that a business generate selling its core means of business, its product. Revenue is also referred to as the ‘Top Line’ due to its position in the Income Statement.

Expenses are all the cost an organisation incurs in conducting it’s daily operations ie salaries, rent, cost of stock/product, etc.

The Income Statement are divided into six profit areas, each showing a specific level of profit namely:

  • Gross Profit (GP)
  • Net Contribution
  • Operating Profit (OP)
  • Profit Before Tax (PBT)
  • Net Profit / Profit After Tax (PAT)
  • Retained Profit (RP)


In the Book “What the Numbers Mean“, Renier provides a detailed overview of each of the profit areas within the Income Statement. He also covers concepts like “Top Line” and “Bottom Line” as well as key Finacial performance KPIs like Gross Margin, Net Contribution and Operating Profit and how this P&L information can be used in daily operational management to improve efficiency and profitability.

What-the-numbers-mean-1

You can obtain a copy of the book “What the Numbers Mean” from LeanPub here…

LeanpubLogo1200x610_300ppi

Also Read…