Many people don’t realize that data acts as a sort of digital currency. They tend to imagine paper dollars or online monetary transfers when they think of currency. Data fits the bill—no pun intended—because you can use it to exchange economic value.
In today’s world, data is the most valuable asset that a company can possess. It is the fuel that powers the digital economy and drives innovation. The amount of data generated every day is staggering, and it is growing at an exponential rate. According to a report by IBM, 90% of the data in the world today has been created in the last two years. This explosion of data has led to a new era where data is considered as valuable as gold or oil. There is an escalating awareness of the value within data, and more specifically the practical knowledge and insights that result from transformative data engineering, analytics and data science.
In the field of business, data-driven insights have assumed a pivotal role in informing and directing decision-making processes – the data-driven organisation. Data is the lifeblood of technology companies. It is what enables them to create new products and services, optimise their operations, and make better decisions. Companies irrespective of size, that adopt the discipline of data science, undertake a transformative process enabling them to capitalise on data value to enhance operational efficiencies, understand customer behaviour, identify new market opportunities to gain an competitive advantage.
- Innovation: One of the most significant benefits of data is its ability to drive innovation. Companies that have access to large amounts of data can use it to develop new products and services that meet the needs of their customers. For example, Netflix uses data to personalise its recommendations for each user based on their viewing history. This has helped Netflix become one of the most successful streaming services in the world.
- Science and Education: In the domain of scientific enquiry and education, data science is the principal catalyst for the revelation of profound universal truths and knowledge.
- Operational optimisation & Efficiency: Data can also be used to optimise operations and improve efficiency. For example, companies can use data to identify inefficiencies in their supply chain and make improvements that reduce costs and increase productivity. Walmart uses data to optimise its supply chain by tracking inventory levels in real-time. This has helped Walmart reduce costs and improve its bottom line.
- Data-driven decisions: Another benefit of data is its ability to improve decision-making. Companies that have access to large amounts of data can use it to make better decisions based on facts rather than intuition. For example, Google uses data to make decisions about which features to add or remove from its products. This has helped Google create products that are more user-friendly and meet the needs of its customers.
- Artificial Intelligence: Data is the fuel that powers AI. According to Forbes, AI systems can access and analyse large datasets so, if businesses are to take advantage of the explosion of data as the fuel powering digital transformation, they’re going to need to artificial intelligence and machine learning to help transform data effectively, so they can deliver experiences people have never seen before or imagined. Data is a crucial component of AI and organizations should focus on building a strong foundation for their data in order to extract maximum value from AI. Generative AI is a type of artificial intelligence that can learn from existing artifacts to generate new, realistic artifacts that reflect the characteristics of the training data but don’t repeat it. It can produce a variety of novel content, such as images, video, music, speech, text, software code and product designs. According to McKinsey, the value of generative data lies within your data – properly prepared, it is the most important thing your organisation brings to AI and where your organisation should spend the most time to extract the most value.
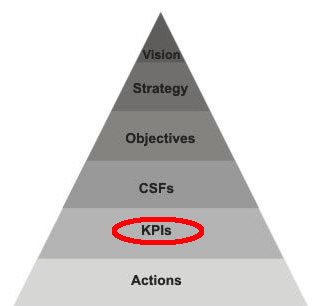
- Commercial success: The language of business is money and business success is measured in the commercial achievement on the organisation. Data is an essential component in measuring business success. Business success metrics are quantifiable measurements that business leaders track to see if their strategies are working effectively. Success metrics are also known as key performance indicators (KPIs). There is no one-size-fits-all success metric, most teams use several different metrics to determine success. Establishing and measuring success metrics is an important skill for business leaders to develop so that they can monitor and evaluate their team’s performance. Data can be used to create a business score card, an informed report that allows businesses to analyse and compare information that they can use to measure their success. An effective data strategy allows businesses to focus on specific data points, which represent processes that impact the company’s success (critical success criteria). The three main financial statements that businesses can use to measure their success are the income statement, balance sheet, and cash flow statement. The income statement measures the profitability of a business during a certain time period by showing its profits and losses. Operational data combined/aligned with the content of the financial statements enable business to measure, in monetary terms, the key success indicators to drive business success.
- Strategic efficacy: Data can also be used to assess strategy efficacy. If a business is implementing a new strategy or tactic, it can use data to gauge whether or not it’s working. If the business measured its metrics before implementing a new strategy, it can use those metrics as a benchmark. As it implements the new strategy, it can compare those new metrics to its benchmark and see how they stack up.
In conclusion, data is an essential component in business success. Data transformed into meaningful and practical knowledge and insights resulting from transformative data engineering, analytics and data science is a key business enabler. This makes data a currency for the technology driven business. Companies that can harness the power of data are the ones that will succeed in today’s digital economy.
Data insight brings understanding that leads to actions driving continuous improvement, resulting in business success.
Also read…