
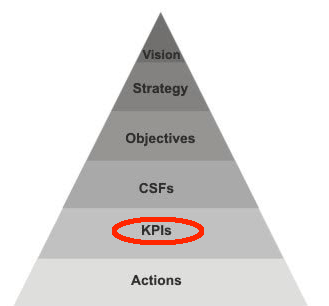
KPIs (Key Performance Indicators) are a critical management tool to measure the success and progress of effort put in towards achieving goals and targets – to continually improve performance.
Every business set their specific KPIs to measure the criteria that drive the business success – these vary from business to business. One thing every modern business has in common though, is IT – the enabler that underpin operational processes and tools used to commerce daily. Setting KPIs that measure the success of IT operations does not just help IT leadership to continuously improve but also proof the value of IT to the business.
Here are ten IT KPIs that matter most to modern business
1. % of IT investment into business initiative (customer-facing services and business units)
How well does the IT strategy, reflected in the projects it is executing, align with the business strategy? This metrics can help to align IT spend with business strategy and potentially eliminate IT projects for IT that does not align directly with business objectives.
2. % Business/Customer facing Services meeting SLAs (Service Level Agreements)
IT is delivering service to customers; these are internal to the business but can also be delivered external to the business’ client/customers directly. Are these services meeting required expectations and quality – in the eye of the customer? What can be done to improve.
3. IT Spend vs Plan/Budget
Budgets are set for a purpose – it is a financial guideline that indicates the route to success. How is IT performing against budget, against plans? Are you over-spending against the set plans? Why? Is it because of a problem in the planning cycle or something else? If you are over-spending/under-spending, in which areas do this occur?
Knowing this metrics give you the insight to take corrective actions and bring IT spend inline with budgets.
4. IT spend by business unit
IT service consumptione is driven by user demand. How is IT costs affected by the user demands by business unit – are business units responsible to cover their IT cost, hence owning up to the overall business efficiency. This metrics put the spotlight on the fact that IT is not free and give business unit manager visibility of their IT consumption and spend.
5. % Split of IT investment to Run, Grow, Transform the business
This is an interesting one for the CIO. Businesses usually expects IT to spend more money in growing the business but reality is that the IT cost of running the business is driven by the demand from IT users with an increased cost implication. Business transformation, now a key topic in every board meeting, needs a dedicated budget to succeed. How do these three investment compare in comparison with business strategic priorities.
6. Application & Service TCO (Total Cost of Ownership)
What is the real cost of delivering IT services and application. Understanding the facts behind what makes up the total cost of IT and which applications/services are the most expensive, can help to identify initiatives to improve.
7. Infrastructure Unit Cost vs Target & Benchmarks
How do you measure the efficiency of your IT infrastructure and how does this compare with the industry benchmark? This is a powerful metrics to justify ROI (Return on Investment), IT’s value proposition, IT strategy and the associated budget.
8. % Projects on Time, Budget & Spec
Is the project portfolio under control? Which projects need remediation to get back on track and what can be learned from projects that do run smoothly?
9. % Project spend on customer-facing initiatives
How much is invested in IT projects in the business for the business (affecting the bottom line) in comparison with customer-centric projects that impacts the business’ top line.
10. Customer satisfaction scores for business/customer facing services
Measure the satisfaction of not just the internal business units that consume IT services but also the business’ customer’s satisfaction with customer-facing IT services. Understand what the customer wants and make the needed changes to IT operations to continuously improve customer satisfaction.
In the famous words of Peter Drucker “What gets measured gets improved”, KPIs give you the insight to understand:
- your customer
- your market
- your financial performance
- your internal process efficiency
- your employee performance
Insight brings understanding that leads to actions driving continuously improve.

