Digital Strategy & the Board

Digital Strategy is a plan that uses digital resources to achieve one or more objectives. With Technology changing at a very fast pace, Organisations have many digital resources to choose from.

Digital Resources can be defined as materials that have been conceived and created digitally or by converting analogue materials to a digital format for example:

  • Utilising the internet for commerce (web-shops, customer service portals, etc…)
  • Secure working for all employees from anywhere via VPN
  • Digital documents, scanning paper copies and submitting online correspondence to customers i.e. online statements and payment facilities via customer portals
  • Digital resources via Knowledge Base, Wiki, Intranet site and Websites
  • Automation – use digital solutions like robotics and AI to complete repetitive tasks more efficiently
  • Utilising social media for market awareness, customer engagement and advertising

A Digital Strategy is typically a plan that helps the business to transform it’s course of action, operations and activities into a digital nature by utilising available applicable technology.

Many directors know that digital strategies, and there related spending, can be difficult to understand. From blockchain and virtual reality to artificial intelligence, no business can afford to fall behind with the latest technological innovations that are redefining how businesses connect with their customers, employees, and myriad of other stakeholders. Read this post that covers “The Digital Transformation Necessity“…

As a Board Director what are the crucial factors that the Board should consider when building a digital strategy?

Here are five critical aspects, in more detail, and the crucial things to be conscious of when planning a digital transformation strategy as part of a board.

Stakeholders

A stakeholder, by definition, is usually an individual or a group impacted by the outcome of a project. While in previous roles you may have worked with stakeholders at senior management level, when planning a digital strategy, it’s important to remember that your stakeholders could also include customers, employees or anyone that could be affected by a new digital initiative.

Digital strategies work from the top down, if you’re looking to roll out a digital transformation project, you need to consider how it will affect every person inside or outside of your business.

Investment

Digital transformation almost always involves capital and technology-intensive investments. It is not uncommon for promising transformation projects to stall because of a lack of funds, or due to technology infrastructure that cannot cope with increased demands.

Starting a budgeting process right at the start of planning a digital transformation project is essential. This helps ensure that the scope of a project does not grow beyond the capabilities of an enterprise to fund it. A realistic budgeting and funding approach is crucial because a stalled transformation project creates disruption, confusion and brings little value to a business.

Communications

From the get-go, any digital strategy, regardless of size, should be founded on clear and constant communication between all stakeholders involved in a project. This ensures everyone is in the loop on the focus of the project, their specific roles within it, and which processes are going to change. In addition, continuous communication helps build a spirit of shared success and ensures everyone has the information they need to address any frustrations or challenges that may occur as time passes. When developing an effective communication plan, Ian’s advice is to hardly mention the word digital at all.

The best digital strategies explain what digital can do and also explain the outcomes. Successful communication around digital strategies uses language that everyone can understand, plain English, no buzzwords, no crazy acronyms and no silly speak.

Also read “Effective Leadership Communication” which covers how you can communicate effectively to ensure that everyone in the team are on the same page.

Technology

While there are many technologies currently seeing rapid growth and adoption, it doesn’t necessarily mean that you will need to implement all of them in your business. The choice of technology depends upon the process you are trying to optimise. Technology, as a matter of fact, is just a means to support your idea and the associated business processes.

People often get overwhelmed with modern technologies and try to implement all of them in their current business processes. The focus should be on finding the technologies that rightly fit your business objectives and implement them effectively.

Never assume that rolling out a piece of technology is just going to work. When embarking on a digital project, deciding what not to do is just as important as deciding what to do. Look at whether a piece of technology can actually add value to your business or if it’s just a passing trend. Each digital project should hence be presented to Board with a business case that outlines the business value, return on investment and the associated benefits and risks, for board consideration.
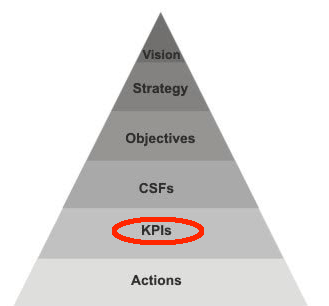
Measurement

No strategy is complete without a goal and a Digital Strategy is no different. To measure the effectiveness of your plan you will need to set up some key performance indicators (KPIs). These metrics will demonstrate the effectiveness of the plan and will also guide your future decision making. You will need to set up smart goals that have clear achievable figures along with a timeline. These goals will guide and optimise the entire execution of a transformation project and ensure that the team does not lose focus.

Any decent strategy should say where we are now, where we want to get to and how we’re going to get there, but also, more importantly, how are we going to monitor and track against our progress.

Also Read

Advertisement

GANTT Charts

A Gantt chart is a horizontal bar chart developed as a production control tool in 1917 by Henry L. Gantt, an American engineer and social scientist. Frequently used in project management, a Gantt chart provides a graphical illustration of a schedule that helps to plan, coordinate, and track specific tasks in a project.

Gantt charts may be simple versions created on graph paper or more complex automated versions created using project management applications such as Microsoft Project or Excel.

A Gantt chart is constructed with a horizontal axis representing the total time span of the project, broken down into increments (for example, days, weeks, or months) and a vertical axis representing the tasks that make up the project (for example, if the project is outfitting your computer with new software, the major tasks involved might be: conduct research, choose software, install software). Horizontal bars of varying lengths represent the sequences, timing, and time span for each task. Using the same example, you would put “conduct research” at the top of the verticle axis and draw a bar on the graph that represents the amount of time you expect to spend on the research, and then enter the other tasks below the first one and representative bars at the points in time when you expect to undertake them. The bar spans may overlap, as, for example, you may conduct research and choose software during the same time span. As the project progresses, secondary bars, arrowheads, or darkened bars may be added to indicate completed tasks, or the portions of tasks that have been completed. A vertical line is used to represent the report date.

Gantt charts give a clear illustration of project status, but one problem with them is that they don’t indicate task dependencies – you cannot tell how one task falling behind schedule affects other tasks. The PERT Chart, another popular project management charting method, is designed to do this. Automated Gantt charts store more information about tasks, such as the individuals assigned to specific tasks, and notes about the procedures. They also offer the benefit of being easy to change, which is helpful. Charts may be adjusted frequently to reflect the actual status of project tasks as, almost inevitably, they diverge from the original plan.

Also Read…

Management Communication Plan

PERT Charts

A PERT chart is a project management tool used to schedule, organize, and coordinate tasks within a project. PERT stands for Program Evaluation Review Technique, a methodology developed by the U.S. Navy in the 1950s to manage the Polaris submarine missile program. A similar methodology, the Critical Path Method (CPM) was developed for project management in the private sector at about the same time.

PERT Chart 1

A PERT chart presents a graphic illustration of a project as a network diagram consisting of numbered nodes (either circles or rectangles) representing events, or milestones in the project linked by labelled vectors (directional lines) representing tasks in the project. The direction of the arrows on the lines indicates the sequence of tasks. In the diagram, for example, the tasks between nodes 1, 2, 4, 8, 9 and 10 must be completed in sequence. These are called dependent or serial tasks. The tasks between nodes 2 and 3, and nodes 2 and 4 are not dependent on the completion of one to start the other and can be undertaken simultaneously. These tasks are called  parallel or concurrent tasks. Tasks that must be completed in sequence but that don’t require resources or completion time are considered to have event dependency. These are represented by dotted lines with arrows and are called dummy activities. For example, the dashed arrow linking nodes 6 and 9 indicates that the system files must be converted before the user test can take place, but that the resources and time required to prepare for the user test (writing the user manual and user training) are on another path. Numbers on the opposite sides of the vectors indicate the time allotted for the task.

The PERT chart is sometimes preferred over the Gantt Chart, another popular project management charting method, because it clearly illustrates task dependencies. On the other hand, the PERT chart can be much more difficult to interpret, especially on complex projects. Frequently, project managers use both techniques.

Also Read…

Management Communication Plan

Business Driven IT KPIs

KPIs (Key Performance Indicators) are a critical management tool to measure the success and progress of effort put in towards achieving goals and targets – to continually improve performance.

Every business set their specific KPIs to measure the criteria that drive the business success – these vary from business to business. One thing every modern business has in common though, is IT – the enabler that underpin operational processes and tools used to commerce daily. Setting KPIs that measure the success of IT operations does not just help IT leadership to continuously improve but also proof the value of IT to the business.

Here are ten IT KPIs that matter most to modern business

1. % of IT investment into business initiative (customer-facing services and business units)
How well does the IT strategy, reflected in the projects it is executing, align with the business strategy? This metrics can help to align IT spend with business strategy and potentially eliminate IT projects for IT that does not align directly with business objectives.

2. % Business/Customer facing Services meeting SLAs (Service Level Agreements)
IT is delivering service to customers; these are internal to the business but can also be delivered external to the business’ client/customers directly. Are these services meeting required expectations and quality – in the eye of the customer? What can be done to improve.

3. IT Spend vs Plan/Budget
Budgets are set for a purpose – it is a financial guideline that indicates the route to success. How is IT performing against budget, against plans? Are you over-spending against the set plans? Why? Is it because of a problem in the planning cycle or something else? If you are over-spending/under-spending, in which areas do this occur?

Knowing this metrics give you the insight to take corrective actions and bring IT spend inline with budgets.

4. IT spend by business unit
IT service consumptione is driven by user demand. How is IT costs affected by the user demands by business unit – are business units responsible to cover their IT cost, hence owning up to the overall business efficiency. This metrics put the spotlight on the fact that IT is not free and give business unit manager visibility of their IT consumption and spend.

5. % Split of IT investment to Run, Grow, Transform the business
This is an interesting one for the CIO. Businesses usually expects IT to spend more money in growing the business but reality is that the IT cost of running the business is driven by the demand from IT users with an increased cost implication. Business transformation, now a key topic in every board meeting, needs a dedicated budget to succeed. How do these three investment compare in comparison with business strategic priorities.

6. Application & Service TCO (Total Cost of Ownership)
What is the real cost of delivering IT services and application. Understanding the facts behind what makes up the total cost of IT and which applications/services are the most expensive, can help to identify initiatives to improve.

7. Infrastructure Unit Cost vs Target & Benchmarks
How do you measure the efficiency of your IT infrastructure and how does this compare with the industry benchmark? This is a powerful metrics to justify ROI (Return on Investment), IT’s value proposition, IT strategy and the associated budget.

8. % Projects on Time, Budget & Spec
Is the project portfolio under control? Which projects need remediation to get back on track and what can be learned from projects that do run smoothly?

9. % Project spend on customer-facing initiatives
How much is invested in IT projects in the business for the business (affecting the bottom line) in comparison with customer-centric projects that impacts the business’ top line.

10. Customer satisfaction scores for business/customer facing services

Measure the satisfaction of not just the internal business units that consume IT services but also the business’ customer’s satisfaction with customer-facing IT services. Understand what the customer wants and make the needed changes to IT operations to continuously improve customer satisfaction.

KPI vs Vision

In the famous words of Peter Drucker “What gets measured gets improved”, KPIs give you the insight to understand:

  • your customer
  • your market
  • your financial performance
  • your internal process efficiency
  • your employee performance

Insight brings understanding that leads to actions driving continuously improve.